Back Corba característica de funcionament del receptor Catalan ROC křivka Czech ROC-Kurve German Curva ROC Spanish منحنی مشخصه عملکرد سیستم Persian Courbe ROC French עקומת ROC HE Receiver operating characteristic Italian 受信者操作特性 Japanese 수신자 조작 특성 Korean
This article needs additional citations for verification. (September 2023) |

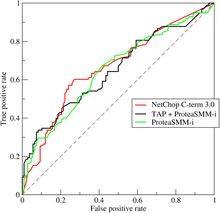
A receiver operating characteristic curve, or ROC curve, is a graphical plot that illustrates the performance of a binary classifier model (can be used for multi class classification as well) at varying threshold values.
The ROC curve is the plot of the true positive rate (TPR) against the false positive rate (FPR) at each threshold setting.
The ROC can also be thought of as a plot of the statistical power as a function of the Type I Error of the decision rule (when the performance is calculated from just a sample of the population, it can be thought of as estimators of these quantities). The ROC curve is thus the sensitivity or recall as a function of false positive rate.
Given the probability distributions for both true positive and false positive are known, the ROC curve is obtained as the cumulative distribution function (CDF, area under the probability distribution from to the discrimination threshold) of the detection probability in the y-axis versus the CDF of the false positive probability on the x-axis.
ROC analysis provides tools to select possibly optimal models and to discard suboptimal ones independently from (and prior to specifying) the cost context or the class distribution. ROC analysis is related in a direct and natural way to cost/benefit analysis of diagnostic decision making.
© MMXXIII Rich X Search. We shall prevail. All rights reserved. Rich X Search
