Back صفيحة القارة القطبية الجنوبية الجليدية Arabic Indlandsis de L'Antártida AST Glacera continental de l'Antàrtida Catalan Antarktis’ iskappe Danish Antarktischer Eisschild German Φύλλο πάγου της Ανταρκτικής Greek Antarkta glacitavolo Esperanto Indlandsis de la Antártida Spanish Antarktise jääkilp Estonian Antartikako izotz-geruza Basque
| Antarctic Ice Sheet | |
|---|---|
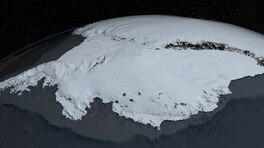 South facing visualization of the Antarctic ice sheet from the Pacific sector of the Southern Ocean (West Antarctic ice sheet, foreground; Antarctic Peninsula, to the left; East Antarctic ice sheet, background).[1][2] | |
 Geographic map of Antarctica, with the grounded ice sheet in white, its floating ice shelves in gray, and ice-free land in brown. | |
| Type | Ice sheet |
| Location | Antarctica |
| Area | 14×106 km2 (5.4×10⁶ sq mi)[3] |
| Thickness | 2.2 km (1.4 mi) on average,[3] 4.9 km (3.0 mi) at maximum[2] |
| Status | Ongoing net loss of ice, regionally variable[4][5] |
The Antarctic ice sheet is a continental glacier covering 98% of the Antarctic continent, with an area of 14 million square kilometres (5.4 million square miles) and an average thickness of over 2 kilometres (1.2 mi). It is the largest of Earth's two current ice sheets, containing 26.5 million cubic kilometres (6,400,000 cubic miles) of ice, which is equivalent to 61% of all fresh water on Earth. Its surface is nearly continuous, and the only ice-free areas on the continent are the dry valleys, nunataks of the Antarctic mountain ranges, and sparse coastal bedrock. However, it is often subdivided into East Antarctic ice sheet (EAIS), West Antarctic ice sheet (WAIS), and Antarctic Peninsula (AP), due to the large differences in topography, ice flow, and glacier mass balance between the three regions.
Because the East Antarctic ice sheet is over 10 times larger than the West Antarctic ice sheet and located at a higher elevation, it is less vulnerable to climate change than the WAIS. In the 20th century, EAIS had been one of the only places on Earth which displayed limited cooling instead of warming, even as the WAIS warmed by over 0.1 °C/decade from 1950s to 2000, with an average warming trend of >0.05 °C/decade since 1957 across the whole continent. As of early 2020s, there is still net mass gain over the EAIS (due to increased precipitation freezing on top of the ice sheet), yet the ice loss from the WAIS glaciers such as Thwaites and Pine Island Glacier is far greater.
By 2100, net ice loss from Antarctica alone would add around 11 cm (5 in) to the global sea level rise. Further, the way WAIS is located deep below the sea level leaves it vulnerable to marine ice sheet instability, which is difficult to simulate in ice sheet models. If instability is triggered before 2100, it has the potential to increase total sea level rise caused by Antarctica by tens of centimeters more, particularly with high overall warming. Ice loss from Antarctica also generates fresh meltwater, at a rate of 1100-1500 billion tons (GT) per year. This meltwater dilutes the saline Antarctic bottom water, which weakens the lower cell of the Southern Ocean overturning circulation and may even contribute to its collapse, although this will likely take place over multiple centuries.
Paleoclimate research and improved modelling show that the West Antarctic ice sheet is very likely to disappear even if the warming does not progress any further, and only reducing the warming to 2 °C (3.6 °F) below the temperature of 2020 may save it. It is believed that the loss of the ice sheet would take place between 2,000 and 13,000 years, although several centuries of high emissions may shorten this to 500 years. 3.3 m (10 ft 10 in) of sea level rise would occur if the ice sheet collapses but leaves ice caps on the mountains behind, and 4.3 m (14 ft 1 in) if those melt as well. Isostatic rebound may also add around 1 m (3 ft 3 in) to the global sea levels over another 1,000 years. On the other hand, the East Antarctic ice sheet is far more stable and may only cause 0.5 m (1 ft 8 in) - 0.9 m (2 ft 11 in) of sea level rise from the current level of warming, which is a small fraction of the 53.3 m (175 ft) contained in the full ice sheet. Around 3 °C (5.4 °F), vulnerable locations like Wilkes Basin and Aurora Basin may collapse over a period of around 2,000 years, which would add up to 6.4 m (21 ft 0 in) to sea levels. The loss of the entire ice sheet would require global warming in a range between 5 °C (9.0 °F) and 10 °C (18 °F), and a minimum of 10,000 years.
- ^ Starr, Cindy (4 June 2013). "Antarctic Bedrock: Bedmap2 Surface Elevation". Scientific Visualization Studio. NASA.
Since 2009, NASA's mission Operation IceBridge (OIB) has flown aircraft over the Antarctic Ice Sheet carrying laser and ice-penetrating radar instruments to collect data about the surface height, bedrock topography and ice thickness.
- ^ a b Fretwell, P.; Pritchard, H. D.; Vaughan, D. G.; Bamber, J. L.; Barrand, N. E.; Bell, R.; Bianchi, C.; Bingham, R. G.; Blankenship, D. D. (2013-02-28). "Bedmap2: improved ice bed, surface and thickness datasets for Antarctica". The Cryosphere. 7 (1): 375–393. Bibcode:2013TCry....7..375F. doi:10.5194/tc-7-375-2013. hdl:1808/18763. ISSN 1994-0424.
- ^ a b Cite error: The named reference
NSFfactsheetwas invoked but never defined (see the help page). - ^ IMBIE team (13 June 2018). "Mass balance of the Antarctic Ice Sheet from 1992 to 2017". Nature. 558 (7709): 219–222. doi:10.1038/s41586-018-0179-y.
- ^ Cite error: The named reference
Rignot2019was invoked but never defined (see the help page).
© MMXXIII Rich X Search. We shall prevail. All rights reserved. Rich X Search