Back Transformación de datos Spanish Преобразование данных (статистика) Russian Перетворення даних (статистика) Ukrainian
This article has multiple issues. Please help improve it or discuss these issues on the talk page. (Learn how and when to remove these template messages)
|

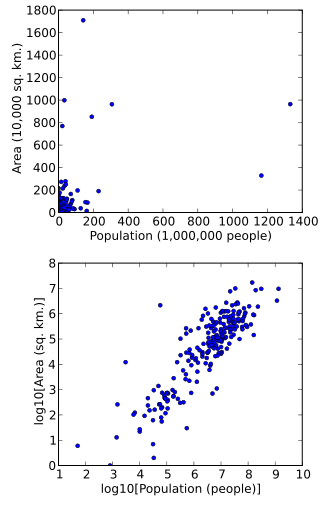
In statistics, data transformation is the application of a deterministic mathematical function to each point in a data set—that is, each data point zi is replaced with the transformed value yi = f(zi), where f is a function. Transforms are usually applied so that the data appear to more closely meet the assumptions of a statistical inference procedure that is to be applied, or to improve the interpretability or appearance of graphs.
Nearly always, the function that is used to transform the data is invertible, and generally is continuous. The transformation is usually applied to a collection of comparable measurements. For example, if we are working with data on peoples' incomes in some currency unit, it would be common to transform each person's income value by the logarithm function.
© MMXXIII Rich X Search. We shall prevail. All rights reserved. Rich X Search