Back الطاقة في المملكة المتحدة Arabic Energía en el Reino Unido Spanish Energia Britanniassa Finnish Énergie au Royaume-Uni French Energi di Britania Raya ID انرژي په بریتانیا کې Pashto/Pushto
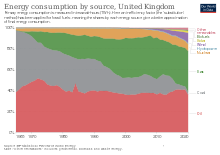
United Kingdom total primary energy consumption by fuel in 2021[1]

Energy in the United Kingdom came mostly from fossil fuels in 2021. Total energy consumption in the United Kingdom was 142.0 million tonnes of oil equivalent (1,651 TWh) in 2019.[2] In 2014, the UK had an energy consumption per capita of 2.78 tonnes of oil equivalent (32.3 MWh) compared to a world average of 1.92 tonnes of oil equivalent (22.3 MWh).[3] Demand for electricity in 2023 was 29.6 GW on average (259 TWh over the year), supplied through 235 TWh of UK-based generation and 24 TWh of energy imports.[4]
Successive UK governments have outlined numerous commitments to reduce carbon dioxide emissions. One such announcement was the Low Carbon Transition Plan launched by the Brown ministry in July 2009, which aimed to generate 30% electricity from renewable sources, and 40% from low-carbon content fuels by 2020. Notably, the UK is one of the best sites in Europe for wind energy, and wind power production is its fastest growing supply.[5][6][7] Wind power contributed 29.4% of UK electricity generation in 2023.[8]
The electricity sector's grid supply for the United Kingdom in 2023 came from 33% fossil fuel power (almost all from natural gas), 50.3% zero-carbon power (including 14.2% nuclear power and 36.1% from wind, solar and hydroelectricity), 5% from biomass, 10.7% imports, and 1% from storage.[8]
Government commitments to reduce emissions are occurring against a backdrop of economic crisis across Europe.[9] During the European financial crisis, Europe's consumption of electricity shrank by 5%, with primary production also facing a noticeable decline. Britain's trade deficit was reduced by 8% due to substantial cuts in energy imports.[10] Between 2007 and 2015, the UK's peak electrical demand fell from 61.5 GW to 52.7. By 2022 it reached 47.1 GW.[11][12][13]
UK government energy policy aims to play a key role in limiting greenhouse gas emissions, whilst meeting energy demand. Shifting availabilities of resources and development of technologies also change the country's energy mix through changes in costs and consumption. In 2018, the United Kingdom was ranked sixth in the world on the Environmental Performance Index,[14] which measures how well a country carries through environmental policy.

- ^ "UK ENERGY IN BRIEF 2021" (PDF). Department for business energy and industrial strategy. 28 July 2022. p. 9. Retrieved 12 September 2022.
- ^ "Energy consumption in the UK 1970 to 2019;" (PDF). Department for Business, Energy, & Industrial Strategy. 22 October 2020. Retrieved 1 April 2022.
- ^ "Energy use (kg of oil equivalent per capita) | Data | Table". Data.worldbank.org. Retrieved 1 April 2022.
- ^ "National Grid: Live". Retrieved 13 May 2024.
- ^ UK Renewable Energy Roadmap Crown copyright, July 2011
- ^ "BBC – Weather Centre – Climate Change – Wind Power". bbc.co.uk. Retrieved 9 June 2015.
- ^ RenewableUK News website article Archived 9 May 2015 at the Wayback Machine
- ^ a b "Britain's Electricity Explained: 2023 Review | ESO". www.nationalgrideso.com. Retrieved 15 May 2024.
- ^ "World Energy Statistics | Energy Supply & Demand". Enerdata. Retrieved 5 October 2013.
- ^ Energy Research Estore. "United Kingdom Energy Report, Enerdata 2012". Enerdata.net. Retrieved 5 October 2013.
- ^ "Peak Light Bulb". New Scientist. 4 January 2014. p. 4.
- ^ "UK Electricity production and demand 2015" (PDF). p. 124.
- ^ "gridwatch templar".
- ^ "Data Explorer :: Table of Main Results | Environmental Performance Index". Epi.yale.edu. Archived from the original on 7 October 2013. Retrieved 5 October 2013.
© MMXXIII Rich X Search. We shall prevail. All rights reserved. Rich X Search