Back Google Public Data Explorer Italian 구글 퍼블릭 데이터 익스플로러 Korean Google Public Data Explorer Ukrainian
The topic of this article may not meet Wikipedia's notability guidelines for products and services. (April 2011) |
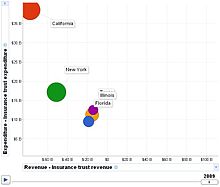
 Example of an animated bubble plot.[1] | |
| Developer(s) | Google Inc. |
|---|---|
| Initial release | 8 March 2010 |
| Platform | Web platform |
| Available in | 40 languages[citation needed] |
| Type | Collaborative software, Data visualization |
| Website | www |
Google Public Data Explorer provides public data and forecasts from a range of international organizations and academic institutions including the World Bank, OECD, Eurostat and the University of Denver.[2][3] These can be displayed as line graphs, bar graphs, cross sectional plots or on maps.[4] The product was launched on March 8, 2010 as an experimental visualization tool in Google Labs.[5]
In 2011 the Public Data Explorer was made available to everyone. The Dataset Publishing Language (DSPL) was created to be used with the platform. Once data is imported, the dataset can be visualized, embedded in external websites, and shared with others.[6]
In May 2016, the addition of the Google Analytics Suite enabled the import of public or individual datasets and provided no-code data visualization tools to users.
- ^ Edwards, Kerstin. "Visualizing Data from Government Census and Surveys: Plans for the Future" (PDF). U.S. Census Bureau. Retrieved 20 January 2015.
- ^ "Pardee Center for International Futures Data Explorer". University of Denver. Retrieved 18 January 2015.
- ^ "Data Providers". Retrieved 18 January 2015.
- ^ "Visualize the data in a dataset". Google Inc. Retrieved 18 January 2015.
- ^ "Statistics for a changing world: Google Public Data Explorer in Labs". Retrieved 20 January 2015.
- ^ Sherman, Chris (16 February 2011). "Visualize Your Own Information With Google Public Data Explorer". Search Engine Land. Retrieved 19 January 2015.
© MMXXIII Rich X Search. We shall prevail. All rights reserved. Rich X Search