Back معامل الارتباط لبيرسون Arabic Coeficient de correlació de Pearson Catalan Korrelationskoeffizient nach Bravais-Pearson German Coeficiente de correlación de Pearson Spanish Lineaarne korrelatsioonikordaja Estonian Korrelazio-koefiziente Basque ضریب همبستگی پیرسون Persian מתאם פירסון HE Indice di correlazione di Pearson Italian 피어슨 상관 계수 Korean


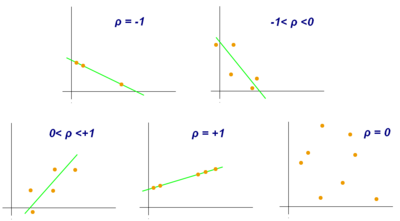
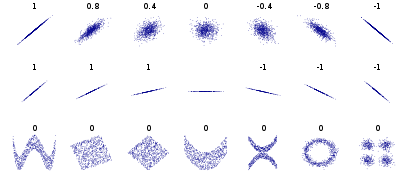
In statistics, the Pearson correlation coefficient (PCC)[a] is a correlation coefficient that measures linear correlation between two sets of data. It is the ratio between the covariance of two variables and the product of their standard deviations; thus, it is essentially a normalized measurement of the covariance, such that the result always has a value between −1 and 1. As with covariance itself, the measure can only reflect a linear correlation of variables, and ignores many other types of relationships or correlations. As a simple example, one would expect the age and height of a sample of teenagers from a high school to have a Pearson correlation coefficient significantly greater than 0, but less than 1 (as 1 would represent an unrealistically perfect correlation).
Cite error: There are <ref group=lower-alpha> tags or {{efn}} templates on this page, but the references will not show without a {{reflist|group=lower-alpha}} template or {{notelist}} template (see the help page).
© MMXXIII Rich X Search. We shall prevail. All rights reserved. Rich X Search