Back مبيان شريط Arabic Bånddiagram Danish Bändermodell (Proteine) German طرح روبانی Persian Modèle ruban French リボンダイアグラム Japanese Lintdiagram Dutch Ленточная диаграмма (биохимия) Russian 飄帶圖 Chinese

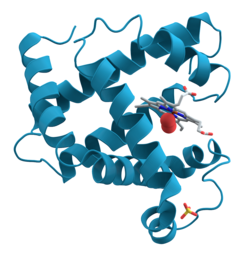
Ribbon diagrams, also known as Richardson diagrams, are 3D schematic representations of protein structure and are one of the most common methods of protein depiction used today. The ribbon depicts the general course and organisation of the protein backbone in 3D and serves as a visual framework for hanging details of the entire atomic structure, such as the balls for the oxygen atoms attached to myoglobin's active site in the adjacent figure. Ribbon diagrams are generated by interpolating a smooth curve through the polypeptide backbone. α-helices are shown as coiled ribbons or thick tubes, β-sheets as arrows, and non-repetitive coils or loops as lines or thin tubes. The direction of the polypeptide chain is shown locally by the arrows, and may be indicated overall by a colour ramp along the length of the ribbon.[1]
Ribbon diagrams are simple yet powerful, expressing the visual basics of a molecular structure (twist, fold and unfold). This method has successfully portrayed the overall organization of protein structures, reflecting their three-dimensional nature and allowing better understanding of these complex objects both by expert structural biologists and by other scientists, students,[2] and the general public.

- ^ Smith, Thomas J. (October 27, 2005). "Displaying and Analyzing Atomic Structures on the Macintosh". Danforth Plant Science Center. Archived from the original on 28 March 2002.
- ^ Richardson, D. C.; Richardson, J. S. (January 2002). "Teaching Molecular 3-D Literacy". Biochemistry and Molecular Biology Education. 30 (1): 21–26. doi:10.1002/bmb.2002.494030010005.
© MMXXIII Rich X Search. We shall prevail. All rights reserved. Rich X Search