Back Diagrama de Schlegel Catalan Schlegeldiagramm German Figuro de Schlegel Esperanto Diagrama de Schlegel Spanish Diagramme de Schlegel French Diagramma di Schlegel Italian Diagram Schlegela Polish Diagramă Schlegel Romanian Диаграмма Шлегеля Russian Schleglov diagram Slovenian


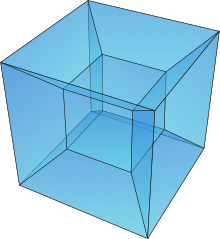
In geometry, a Schlegel diagram is a projection of a polytope from into through a point just outside one of its facets. The resulting entity is a polytopal subdivision of the facet in that, together with the original facet, is combinatorially equivalent to the original polytope. The diagram is named for Victor Schlegel, who in 1886 introduced this tool for studying combinatorial and topological properties of polytopes. In dimension 3, a Schlegel diagram is a projection of a polyhedron into a plane figure; in dimension 4, it is a projection of a 4-polytope to 3-space. As such, Schlegel diagrams are commonly used as a means of visualizing four-dimensional polytopes.
© MMXXIII Rich X Search. We shall prevail. All rights reserved. Rich X Search


