Back Եվրոպական Միության ընդլայնման վիճակագրություն Armenian Статистика расширения Европейского союза Russian Статистичні дані щодо розширення Європейського Союзу Ukrainian
This article needs to be updated. (July 2022) |
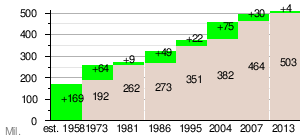 |
| Chart of the population development of the EU affiliated with the enlargement process. |
This is a sequence of tables giving statistical data for past and future enlargements of the European Union. All data refer to the populations, land areas, and gross domestic products (GDP) of the respective countries at the time of their accession to the European Union, illustrating historically accurate changes to the Union. The GDP figures are at purchasing power parity, in United States dollar at 1990 prices.
© MMXXIII Rich X Search. We shall prevail. All rights reserved. Rich X Search