Back اتصال بصري Arabic Визуална комуникация Bulgarian Vizuální komunikace Czech Visuelle Kommunikation German Οπτική επικοινωνία Greek Comunicación visual Spanish Communication visuelle French Comunicación visual Galician תקשורת חזותית HE Vizualna komunikacija Croatian
This article needs additional citations for verification. (August 2013) |

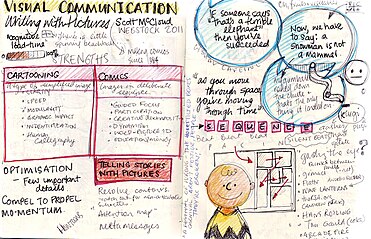
Visual communication is the use of visual elements to convey ideas and information which include (but are not limited to) signs, typography, drawing, graphic design, illustration, industrial design, advertising, animation, and electronic resources.[1] Visual communication has been proven to be unique when compared to other verbal or written languages because of its more abstract structure. It stands out for its uniqueness, as the interpretation of signs varies on the viewer's field of experience.[2] The interpretation of imagery is often compared to the set alphabets and words used in oral or written languages. Another point of difference found by scholars is that, though written or verbal languages are taught, sight does not have to be learned and therefore people of sight may lack awareness of visual communication and its influence in their everyday life.[2] Many of the visual elements listed above are forms of visual communication that humans have been using since prehistoric times.[3] Within modern culture, there are several types of characteristics when it comes to visual elements, they consist of objects, models, graphs, diagrams, maps, and photographs.[4] Outside the different types of characteristics and elements, there are seven components of visual communication: color, shape, tones, texture, figure-ground, balance, and hierarchy.[4]
Each of these characteristics, elements, and components play an important role in daily lives. Visual communication holds a specific purpose in aspects such as social media, culture, politics, economics, and science. In considering these different aspects, visual elements present various uses and how they convey information.[5] Whether it is advertisements, teaching and learning, or speeches and presentations, they all involve visual aids that communicate a message. In reference to the visual aids, the following are the most common: chalkboard or whiteboard, poster board, handouts, video excerpts, projection equipment, and computer-assisted presentations.[6]
- ^ "Subject Week". www.aubg.edu. 2020-11-21. Retrieved 2021-01-28.
- ^ a b Smith, Kenneth L.; Moriarty, Sandra; Kenney, Keith; Barbatsis, Gretchen, eds. (2004-12-13). Handbook of Visual Communication. doi:10.4324/9781410611581. ISBN 9781410611581.
- ^ Eddy, Matthew Daniel. "Diagrams". in Anthony Grafton, Ann Blair and Anja Sylvia Goeing (Eds.), A Companion to the History of Information (Princeton: Princeton University Press, 2020), 397-401.
{{cite journal}}: Cite journal requires|journal=(help) - ^ a b "7 Paramount Components of Visual Communication". Infographic Design Team - Infographics Design - Data Visualization. Retrieved 2021-01-27. https://www.infographicdesignteam.com/blog/components-of-visual-communication/
- ^ Bordley, Robert F. (May 2009). "The Hippocratic Oath, Effect Size, and Utility Theory" (PDF). Medical Decision Making. 29 (3): 377–379. doi:10.1177/0272989X09333128. PMID 19380886. S2CID 45802325.
- ^ Rothwell, J. Dan (2010). In the company of others : an introduction to communication (3rd ed.). New York: Oxford University Press. ISBN 978-0-19-533630-6.[page needed]
© MMXXIII Rich X Search. We shall prevail. All rights reserved. Rich X Search