Back Umlaufgeschwindigkeit des Geldes German Velocidad de circulación del dinero Spanish سرعت گردش پول Persian Rahan kiertonopeus Finnish Vitesse de circulation de la monnaie French Velocità di circolazione della moneta Italian 貨幣の流通速度 Japanese 화폐유통속도 Korean Omloopsnelheid (geld) Dutch Velocidade da moeda Portuguese


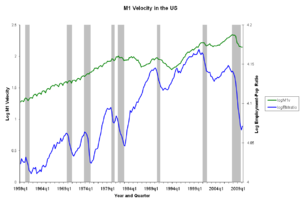
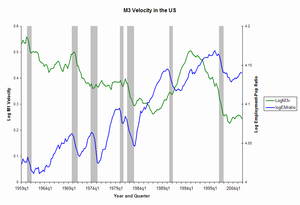
The velocity of money measures the number of times that one unit of currency is used to purchase goods and services within a given time period.[3] In other words, it's how many times money is changing hands. The concept relates the size of economic activity to a given money supply, and the speed of money exchange is one of the variables that determine inflation. The measure of the velocity of money is usually the ratio of the gross national product (GNP) to a country's money supply.
If the velocity of money is increasing, then transactions are occurring between individuals more frequently.[3] The velocity of money changes over time and is influenced by a variety of factors.[4]
Because of the nature of financial transactions, the velocity of money cannot be determined empirically.
- ^ M2 Definition – Investopedia
- ^ M2 Money Stock – Federal Reserve Bank of St Louis
- ^ a b "Money Velocity". Federal Reserve Bank of St. Louis. Retrieved October 28, 2013.
- ^ Mishkin, Frederic S. The Economics of Money, Banking, and Financial Markets. Seventh Edition. Addison–Wesley. 2004. p. 520.
© MMXXIII Rich X Search. We shall prevail. All rights reserved. Rich X Search