Back مخزون Arabic Təklif Azerbaijani Ponuda BS Nabídka Czech Сĕннĕлĕх CV Angebot (Volkswirtschaftslehre) German Ofertado Esperanto Oferta Spanish Eskaintza Basque Tarjooma Finnish

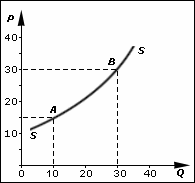
In economics, supply is the amount of a resource that firms, producers, labourers, providers of financial assets, or other economic agents are willing and able to provide to the marketplace or to an individual. Supply can be in produced goods, labour time, raw materials, or any other scarce or valuable object. Supply is often plotted graphically as a supply curve, with the price per unit on the vertical axis and quantity supplied as a function of price on the horizontal axis. This reversal of the usual position of the dependent variable and the independent variable is an unfortunate but standard convention.
The supply curve can be either for an individual seller or for the market as a whole, adding up the quantity supplied by all sellers. The quantity supplied is for a particular time period (e.g., the tons of steel a firm would supply in a year), but the units and time are often omitted in theoretical presentations.
In the goods market, supply is the amount of a product per unit of time that producers are willing to sell at various given prices when all other factors are held constant. In the labor market, the supply of labor is the amount of time per week, month, or year that individuals are willing to spend working, as a function of the wage rate.
In the economic and financial field, the money supply is the amount of highly liquid assets available in the money market, which is either determined or influenced by a country's monetary authority. This can vary based on which type of money supply one is discussing. M1 for example is commonly used to refer to narrow money, coins, cash, and other money equivalents that can be converted to currency nearly instantly. M2 by contrast includes all of M1 but also includes short-term deposits and certain types of market funds.
© MMXXIII Rich X Search. We shall prevail. All rights reserved. Rich X Search