Back التسلسل الزمني لسوق النفط العالمية ابتداء من 2003 Arabic Kenaikan harga minyak semenjak 2003 Malay Aumentos do preço do petróleo desde 2004 Portuguese
This article has multiple issues. Please help improve it or discuss these issues on the talk page. (Learn how and when to remove these template messages)
|


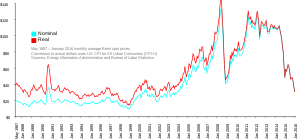
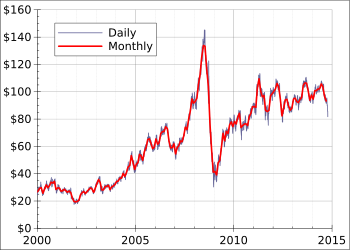
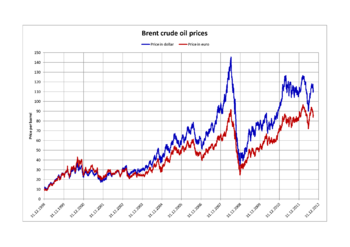
From the mid-1980s to September 2003, the inflation adjusted price of a barrel of crude oil on NYMEX was generally under $25/barrel. Then, during 2004, the price rose above $40, and then $60. A series of events led the price to exceed $60 by August 11, 2005, leading to a record-speed hike that reached $75 by the middle of 2006. Prices then dropped back to $60/barrel by the early part of 2007 before rising steeply again to $92/barrel by October 2007, and $99.29/barrel for December futures in New York on November 21, 2007.[1] Throughout the first half of 2008, oil regularly reached record high prices.[2][3][4][5] Prices on June 27, 2008, touched $141.71/barrel, for August delivery in the New York Mercantile Exchange, amid Libya's threat to cut output, and OPEC's president predicted prices may reach $170 by the Northern summer.[6][7] The highest recorded price per barrel maximum of $147.02 was reached on July 11, 2008.[8] After falling below $100 in the late summer of 2008, prices rose again in late September. On September 22, oil rose over $25 to $130 before settling again to $120.92, marking a record one-day gain of $16.37. Electronic crude oil trading was temporarily halted by NYMEX when the daily price rise limit of $10 was reached, but the limit was reset seconds later and trading resumed.[9] By October 16, prices had fallen again to below $70, and on November 6 oil closed below $60.[10] Then in 2009, prices went slightly higher, although not to the extent of the 2005–2007 crisis, exceeding $100 in 2011 and most of 2012. Since late 2013 the oil price has fallen below the $100 mark, plummeting below the $50 mark one year later.
As the price of producing petroleum did not rise significantly, the price increases have coincided with a period of record profits for the oil industry.[citation needed] Between 2004 and 2007, the profits of the six supermajors – ExxonMobil, Total, Shell, BP, Chevron, and ConocoPhillips – totaled $494.8 billion.[11] Likewise, major oil-dependent countries such as Saudi Arabia, the United Arab Emirates, Canada, Russia, Venezuela and Nigeria have benefited economically from surging oil prices during the 2000s.
The difference between West Texas Intermediate (WTI) crude and Brent crude is greater if the amount of U.S. oil is high, so prices will go down in order to get the oil off the market.[12]
- ^ "Oil reaches new record above $99". BBC. November 21, 2007. Retrieved 2007-11-29.
- ^ "Oil prices pushed to fresh high". BBC News. 2008-02-29. Retrieved 2009-12-31.
- ^ David Goldman (March 12, 2008). "Oil crosses record $110, despite supply rise". CNN Money. Retrieved 2008-03-12.
- ^ John Wilen (March 10, 2008). "Gas Prices Near Records, Following Oil". Associated Press. Archived from the original on 2008-03-13. Retrieved 2008-03-10.
- ^ "Oil sets fresh record above $109". BBC News. March 11, 2008. Retrieved 2008-03-11.
- ^ "Oil Is Little Changed After Falling as Investors Sell Contracts". Bloomberg.com. June 27, 2008.
- ^ "Oil Rises to Record Above $141 as Investors Buy Commodities". Bloomberg.com. June 27, 2008.
- ^ "Oil hits new high on Iran fears". BBC.com. 2008-07-11. Retrieved 2009-12-31.
- ^ "Oil spikes $25 a barrel on anxiety over US bailout".
- ^ Rooney, Ben (November 7, 2008). "Oil holds slim gains". CNN. Retrieved April 21, 2010.
- ^ Global 500, Fortune website, accessed August 2008.
- ^ Myra P. Saefong (September 6, 2019). "Why U.S. crude has outpaced gains for the international oil benchmark this year". Market Watch.
© MMXXIII Rich X Search. We shall prevail. All rights reserved. Rich X Search